2. The Reference Energy System
The reference energy system of the RMC model encompasses a comprehensive macro energy system supply chain, which can be divided into three stages: primary energy extraction, secondary energy processing and conversion, and final energy consumption (Fig. 2-1). The energy demand sectors consist of three major end-use consumption categories: industry, buildings, and transportation. The industrial sector includes traditional energy-intensive industries such as iron and steel, cement, chemicals, general manufacturing, advanced manufacturing, and emerging sectors such as information technology. The transportation sector covers road transport, rail transport, shipping, aviation, etc., with detailed classifications of transport modes available in the relevant chapter of the RMC|Transport model. The building sector includes commercial facilities and residential households. Energy demand is represented in the model as useful energy and is exogenously determined based on socio-economic development projections. The above processes are illustrated in the modeling system structure shown in the figure below.
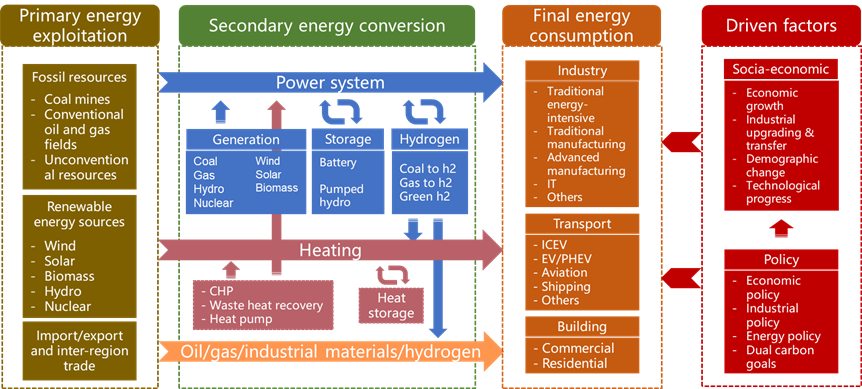
Fig. 2-1: Diagram for modeling system structure.
There are two basic elements in the framework of MESSAGEix, namely energy technologies (also referred to as ‘processes’) and energy commodities. The interconversion and flow of energy commodities are linked through energy technologies (processes), thereby constituting the different components of the energy system. Energy technologies are characterized by a detailed set of parameters. The figure below (Fig. 2-2) illustrates a simplified reference energy system within this framework, and shows the linkages between energy commodities and technologies. Note that this schematic does not include all technological routes (processes) or inter-regional energy flows covered by RMC.
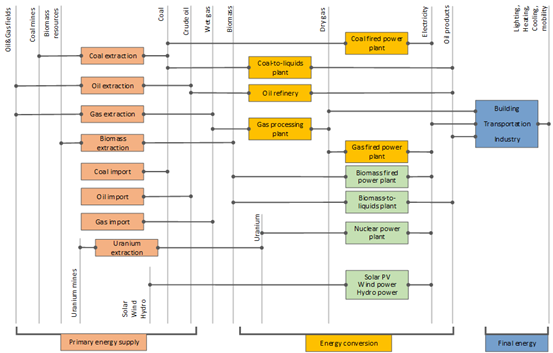
Fig. 2-2: A simplified reference energy system.
The current version of the model involves over 400 energy technologies from energy supply to consumption, covering the full spectrum of energy supply: upstream resource extraction (resource supply), midstream processing and conversion (power plants, refineries, coking plants, etc.), energy transmission, import, and export.
2.1. Energy resource endowments
2.1.1. Fossil fuel reserves and resources
The accessibility and cost of fossil fuels play a critical role in shaping the future of the energy sector, thereby directly impact future climate mitigation pathways. It is imperative to understand the changes in the availability of fossil fuels and their extraction costs. The assumptions on fossil energy resources in RMC are derived from a large amount of sources, including national and global databases such as NBS and the United States Geological Survey (USGS), as well as reports and forecasts from diverse energy research institutes and organizations.
‘Reserves’ in this model refer to the quantities of fossil fuels proven through geological assessment with a significant degree of certainty regarding their existence (proven, probable, or possible) and can be commercially extracted under current economic and technological conditions. ‘Resources’, a broader concept than ‘reserves’, includes those that have not yet been discovered, as well as those that are technologically unfeasible or economically uncompetitive, but might be recoverable in the future, as well as those quantities that have geological potential for extraction, but yet to be found. Table 2-1 shows the calculated fossil fuel resources in the RMC model for 2022. Estimating fossil fuel reserves is built on technological assumptions. With an improvement in technology, the amount that may be considered a ‘reserve’ vs. a ‘resource’ can actually vary widely.
Category |
Resources (ZJ) |
|---|---|
Coal |
40 |
Conventional Oil |
0.8 |
Unconventional Oil |
0.6 |
Conventional Gas |
1.6 |
Unconventional Gas |
1.3 |
China’s coal resources account for approximately 90% of total fossil resource estimates. Oil and natural gas are relatively scarce, with 1.4 ZJ and 2.9 ZJ resources, respectively.
Drawing from multiple sources of information, mainly from some literature and reports (McGlade and Ekins, 2015; China National Administration of Coal Geology, 2016; Li, 2019; Ministry of Natural Resources of the People’s Republic of China, 2021; Welsby et al., 2021), the supply costs of fossil fuels across the country have been estimated. Fig. 2-3 presents the cumulative national resource supply curves for coal, oil, and gas in the RMC model. The blocks in different color shades indicate different resource categories.
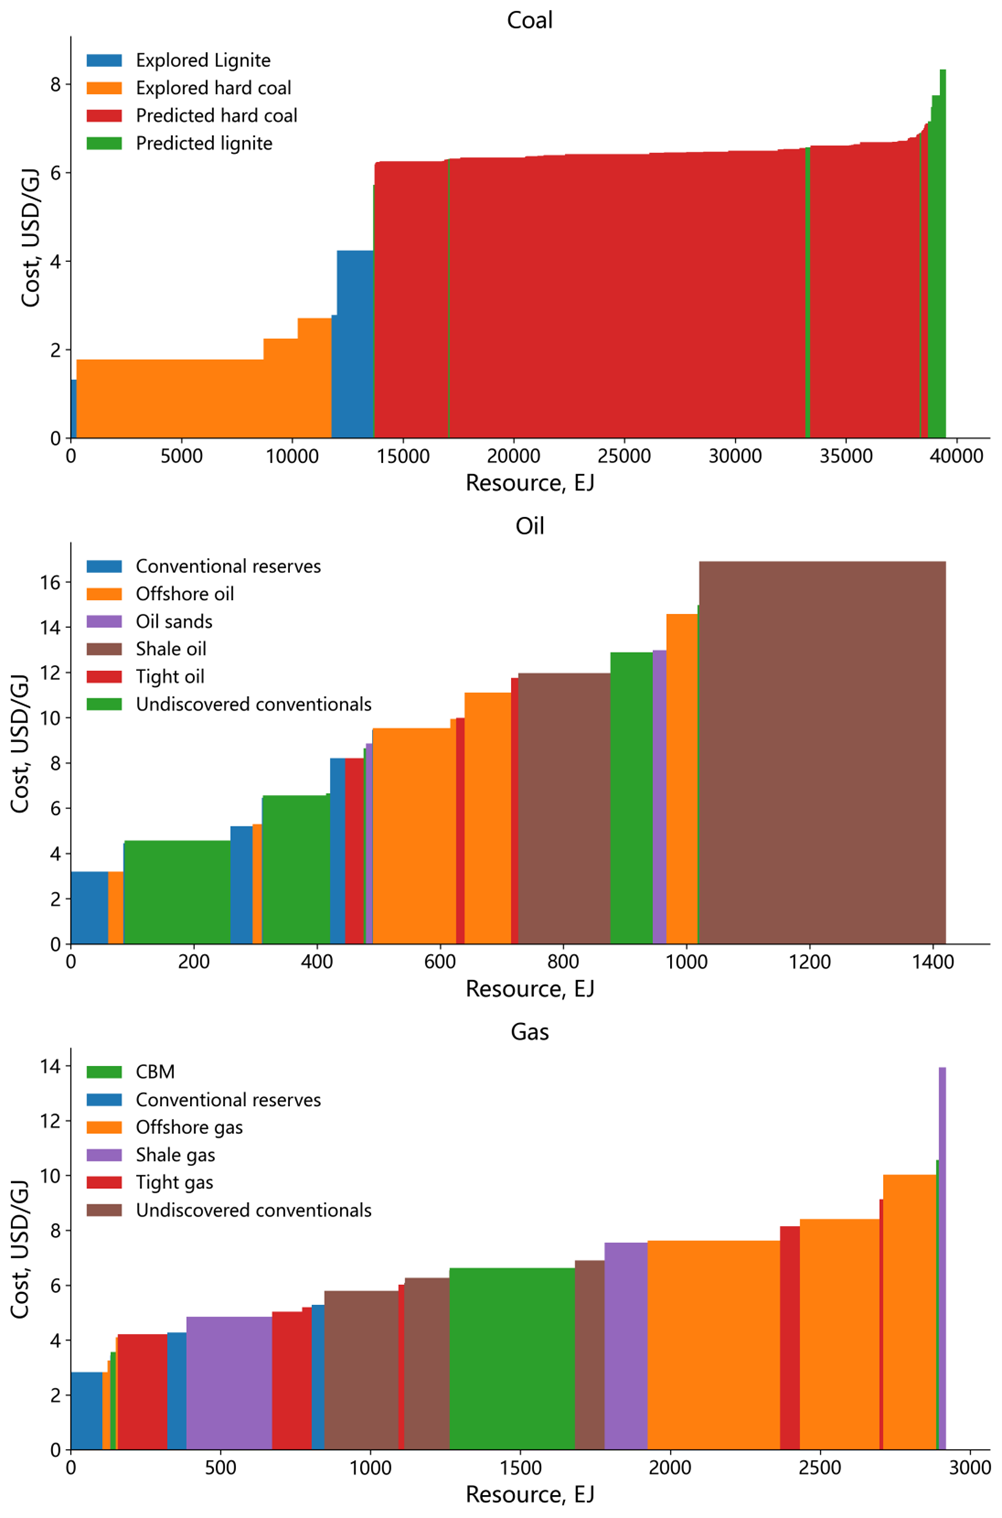
Fig. 2-3: Cumulative national resource supply curves for coal (top), oil (middle), and gas (bottom) in the model.
Coal is the largest and most widely distributed fossil fuel resource in China. Every province except Shanghai has coal resources. In terms of spatial distribution, coal resources are more abundant in the north than in the south. Xinjiang and Inner Mongolia are the two regions with the largest coal resources, followed by Shanxi and Shaanxi. These four provinces in the north account for approximately 79% of the country’s coal resources collectively. The distribution of conventional oil is also mainly in the northern regions, such as Xinjiang, Gansu, Shaanxi, Heilongjiang, and Shandong, all possessing more than 1 Gt of conventional onshore resources. Coastal provinces, including Hainan, Tianjin, and Guangdong, possess offshore oil resources. Unconventional oil, primarily in the form of shale oil, is highly concentrated and mainly distributed in Liaoning, Xinjiang, and Jilin. The distribution patterns of conventional and unconventional natural gas are similar, with Sichuan, Shaanxi, and Inner Mongolia rich in both resources. Thanks to its developed coal industry, Shanxi and Inner Mongolia also have a significant amount of coalbed methane (CBM) resources. Hainan and Guangdong have large offshore natural gas resources that are yet to be exploited. Fig. 2-4 to Fig. 2-11 show the regional distribution of different resource categories.
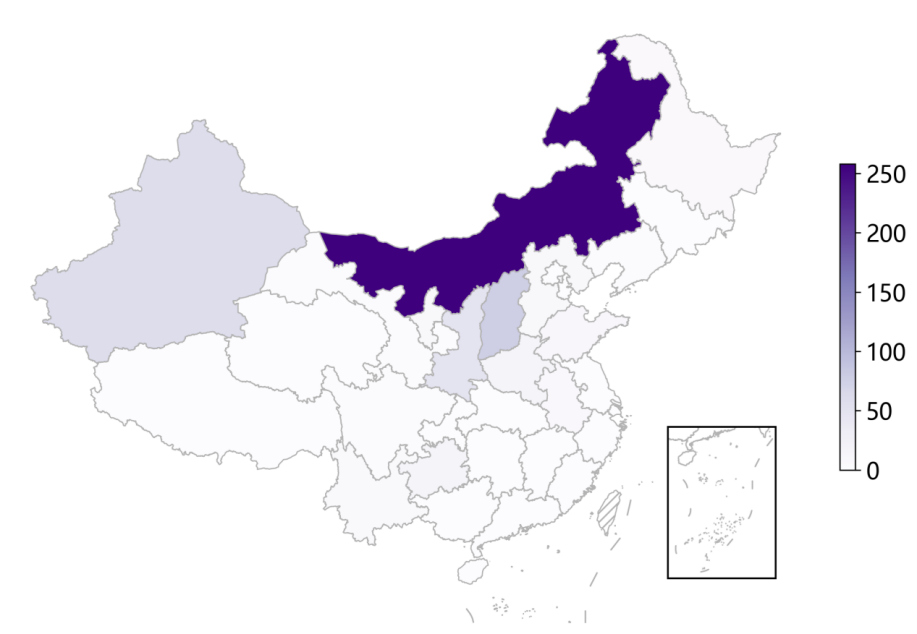
Fig. 2-4: Regional distribution of remaining recoverable explored coal resources (Gt).
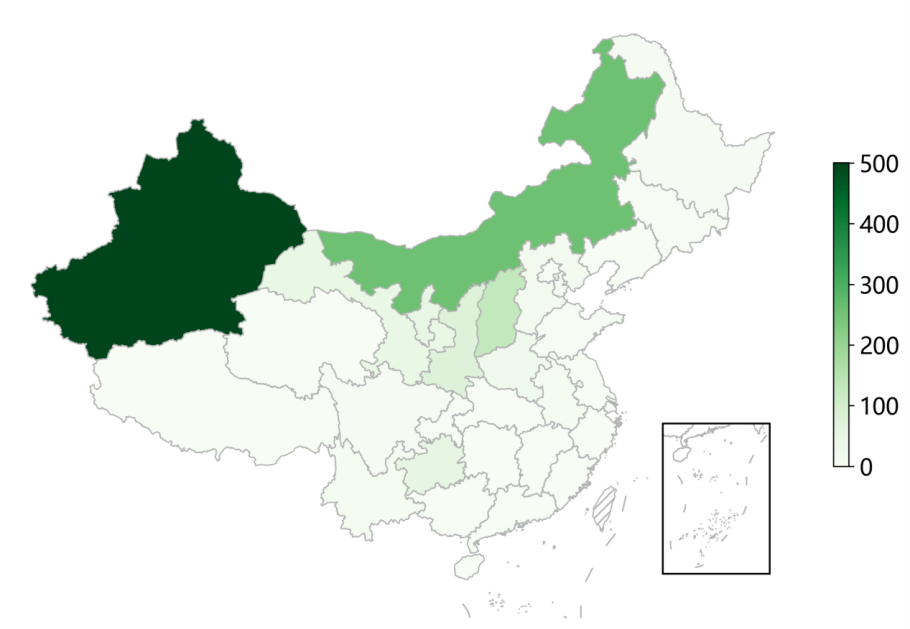
Fig. 2-5: Regional distribution of remaining recoverable predicted coal resources (Gt).
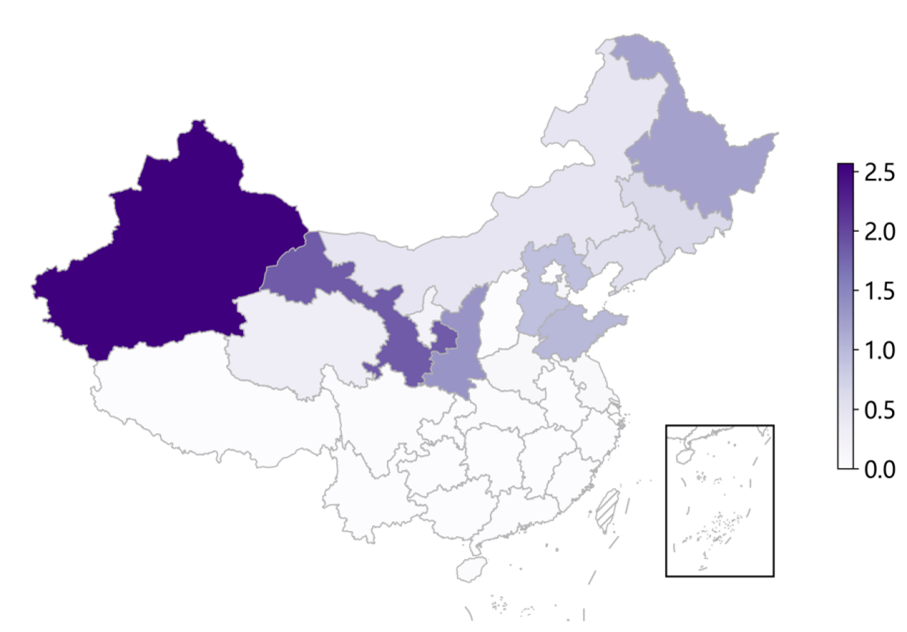
Fig. 2-6: Regional distribution of remaining recoverable conventional onshore oil (Gt).
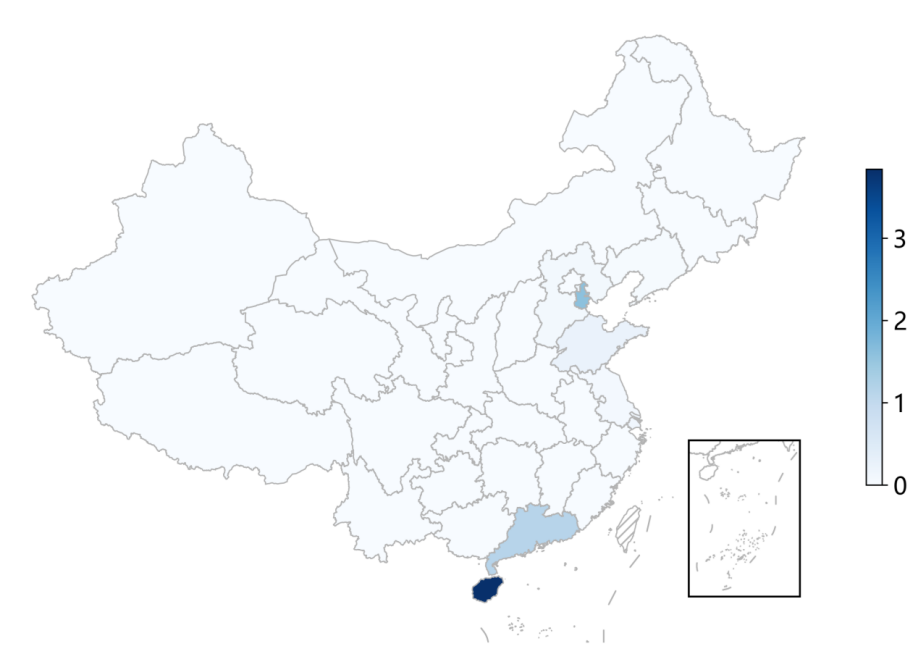
Fig. 2-7: Regional distribution of remaining recoverable offshore oil (Gt).
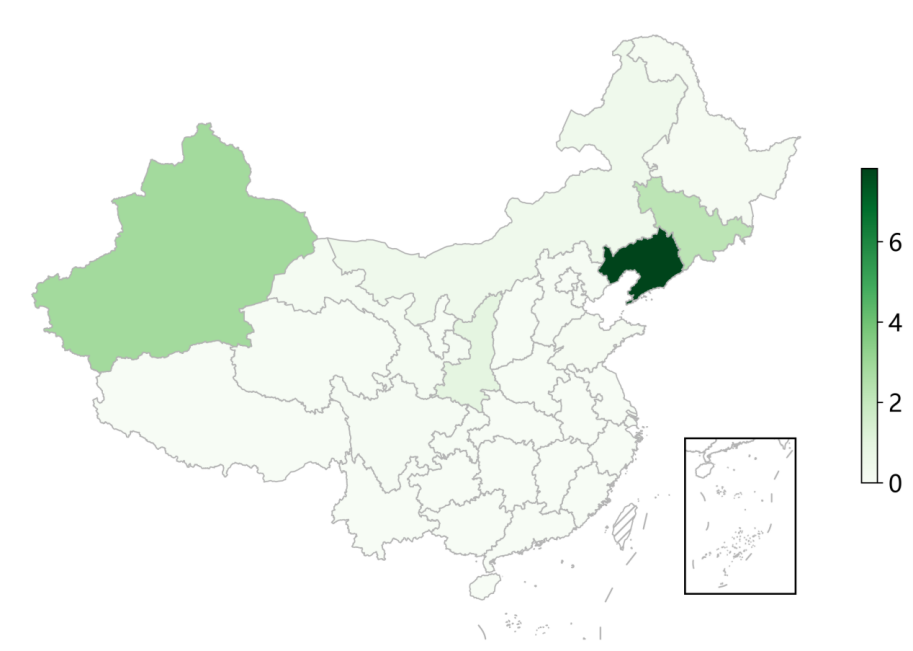
Fig. 2-8: Regional distribution of remaining recoverable unconventional oil (Gt).
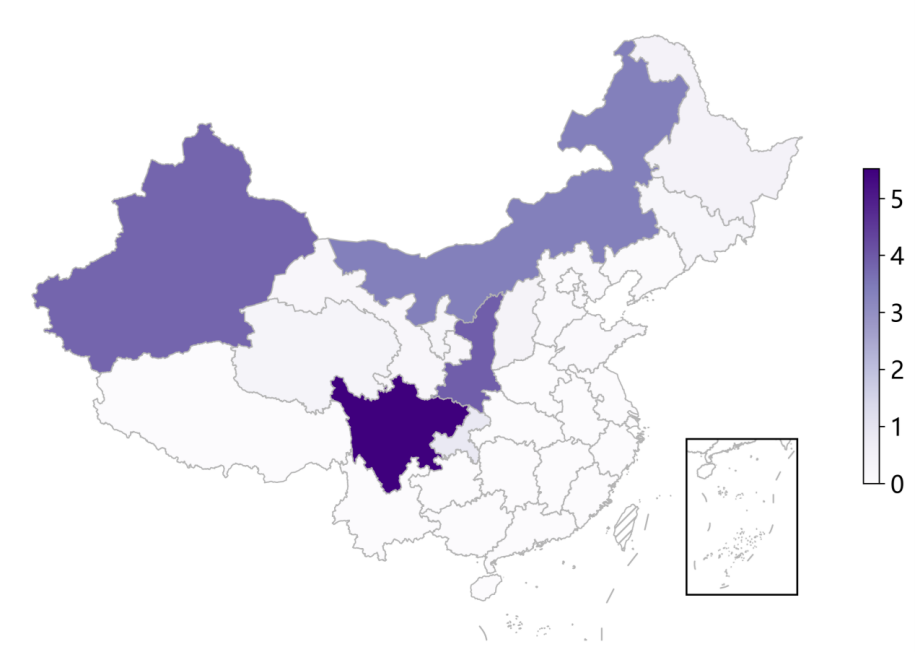
Fig. 2-9: Regional distribution of remaining recoverable conventional onshore gas (Tcm).

Fig. 2-10: Regional distribution of remaining recoverable offshore gas (Tcm).
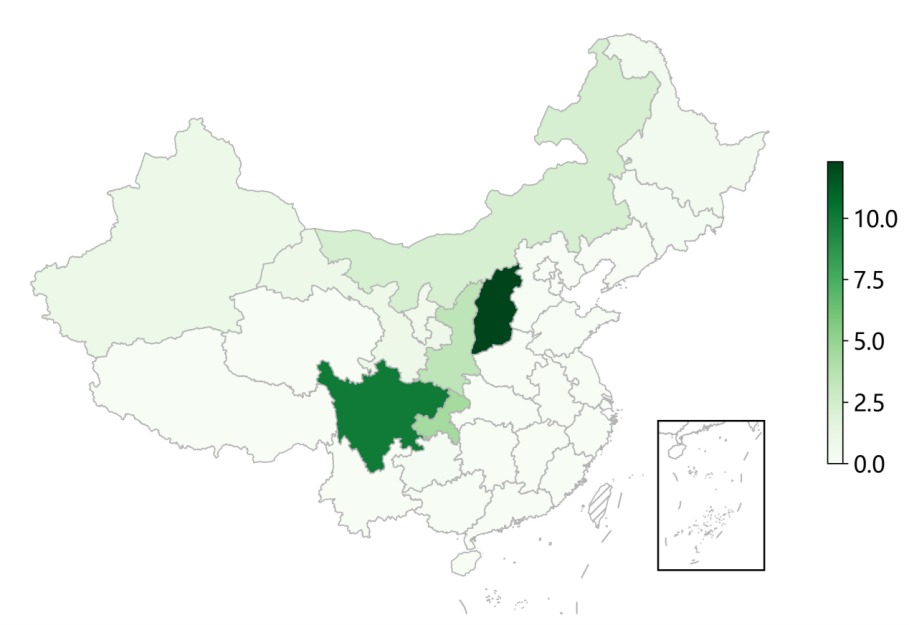
Fig. 2-11: Regional distribution of remaining recoverable unconventional gas (Tcm).
2.1.2. Biomass resources
Biomass energy is a potentially important renewable energy resource in the RMC model. This includes both commercial and non-commercial use. Commercial refers to the use of bioenergy in, for example, power plants or biofuel refineries, while non-commercial refers to the use of bioenergy for residential heating and cooking, primarily in rural households. The estimates of the national biomass resource potential in the model combine multiple sources (Zhang, 2018; Hanssen et al., 2020; Kang et al., 2020; Nie et al., 2020; Biomass Energy Industry Promotion Association et al., 2021; Tian et al., 2021; Biomass Energy Industry Promotion Association and Energy Foundation, 2023; Wang Rui et al., 2023). The biomass resources in the model include agricultural residues, forestry residues, energy crops, municipal sewage, municipal solid waste, and animal manure.
Table 2-2 shows the total volume, collectible volume, and energy utilization potential of China’s biomass resources in the RMC model. The energy use potential is the amount obtained by deducting non-energy uses from the collectible volume. Relying on developed agriculture and animal husbandry, more than 60% of the national total biomass resources come from agricultural residues and animal manure. In southern provinces such as Guangxi and Yunnan, abundant forest resources also provide considerable potential for biomass development. It is noteworthy that despite the substantial potential for growing energy crops across the country, the associated market and industry systems remain underdeveloped. Consequently, it is anticipated that a considerable period will be required for these crops to emerge as the primary source of biomass utilization within China.
Category |
Total resource |
Collectable resource |
Energy use potential |
|---|---|---|---|
Agricultural |
15.3 |
13.3 |
4.2 |
Animal manure |
22.7 |
22.7 |
7.6 |
Energy crops |
16.0 |
16.0 |
16.0 |
Forestry |
5.9 |
5.9 |
2.6 |
Municipal sewage |
0.2 |
0.2 |
0.2 |
Municipal solid waste |
1.7 |
1.7 |
1.7 |
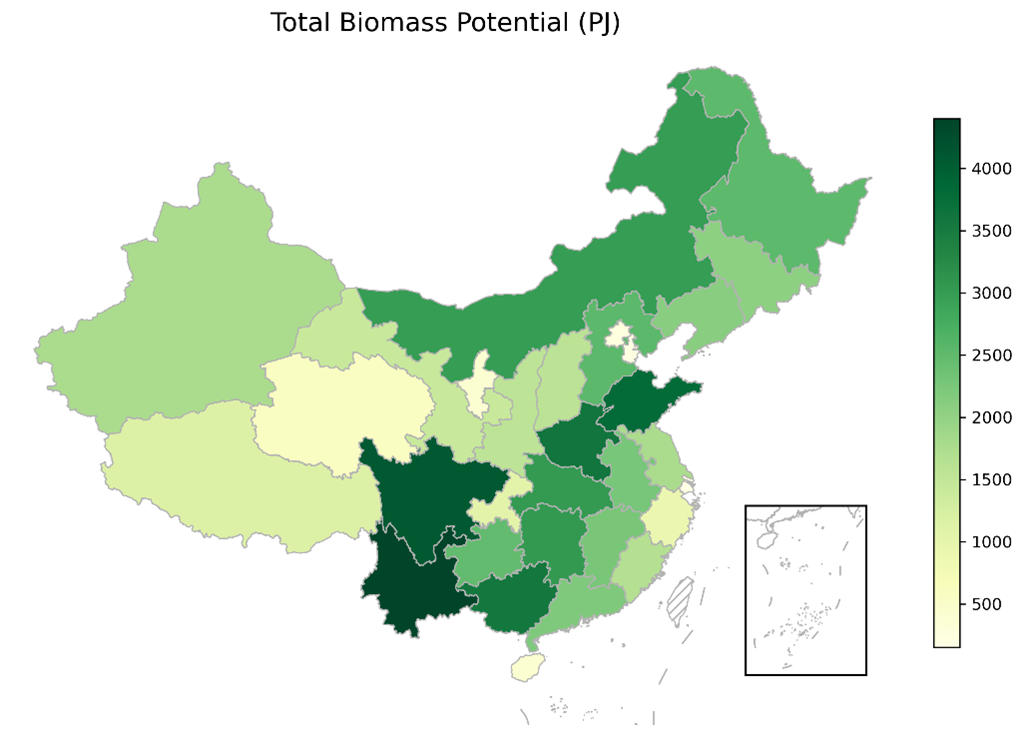
Fig. 2-12: Regional distribution of total biomass potential (PJ).
2.1.3. Wind and Solar Resources
Wind and solar energy, as clean and renewable sources, are of strategic importance for China to achieve its carbon neutrality goal by 2060. Currently, China’s installed capacity of wind and solar power ranks among the highest in the world, yet the development level remains relatively low, accounting for only a small fraction of its vast technical potential, indicating substantial room for growth in resource utilization. The model calibrates the potential of wind and solar resources across provinces by referencing multiple sources, including GIS-based refined assessment studies and annual reports from the China Meteorological Administration (Wang et al., 2022; Chinese Academy of Environmental Planning, 2024; China Meteorological Administration, 2025).
Spatially, wind-rich areas are primarily concentrated in western, northern, and coastal provinces, while solar resources are predominantly located in the western and northern regions, with the ‘three north’ area hosting the majority of the national potential. Specifically, the national technical potential for wind power is approximately 10.9 TW, and for solar power, about 45.6 TW. Overall, China possesses abundant renewable energy resources sufficient to support its energy transition, and future macro-level planning for wind and solar energy bases, along with distributed development, should focus on key regions.
Region |
Installed Capacity (GW) |
Generation (TWh) |
||||||
|---|---|---|---|---|---|---|---|---|
Wind |
Onshore wind |
Offshore wind |
PV |
Central PV |
Distributed PV |
Wind |
PV |
|
Inner Mongolia |
2697 |
2697 |
0 |
9460 |
9230 |
230 |
7143 |
14167 |
Heilongjiang |
706 |
706 |
0 |
301 |
149 |
152 |
1937 |
394 |
Jilin |
304 |
304 |
0 |
356 |
243 |
113 |
861 |
466 |
Liaoning |
289 |
176 |
113 |
191 |
17 |
174 |
777 |
238 |
Gansu |
321 |
321 |
0 |
2758 |
2682 |
76 |
718 |
4128 |
Ningxia |
82 |
82 |
0 |
282 |
253 |
29 |
241 |
391 |
Qinghai |
186 |
186 |
0 |
3914 |
3886 |
28 |
379 |
6491 |
Shanxi |
165 |
165 |
0 |
372 |
298 |
75 |
448 |
458 |
Xinjiang |
618 |
618 |
0 |
21198 |
21054 |
144 |
1293 |
29265 |
Beijing |
0 |
0 |
0 |
61 |
2 |
59 |
0 |
72 |
Hebei |
334 |
281 |
53 |
338 |
59 |
279 |
988 |
587 |
Shandong |
596 |
296 |
300 |
417 |
21 |
395 |
1636 |
552 |
Shaanxi |
127 |
127 |
0 |
311 |
194 |
117 |
364 |
439 |
Tianjin |
15 |
11 |
4 |
42 |
0 |
42 |
42 |
50 |
Chongqing |
43 |
43 |
0 |
22 |
1 |
21 |
108 |
3 |
Guizhou |
109 |
109 |
0 |
104 |
76 |
28 |
296 |
105 |
Sichuan |
223 |
223 |
0 |
157 |
75 |
82 |
621 |
182 |
Xizang |
524 |
524 |
0 |
3332 |
3327 |
4 |
1375 |
6177 |
Guangdong |
677 |
141 |
536 |
202 |
19 |
182 |
1977 |
257 |
Guangxi |
250 |
181 |
69 |
187 |
101 |
86 |
708 |
222 |
Hainan |
246 |
45 |
201 |
29 |
10 |
19 |
563 |
33 |
Yunnan |
132 |
132 |
0 |
115 |
60 |
55 |
374 |
159 |
Henan |
291 |
291 |
0 |
303 |
14 |
289 |
869 |
377 |
Hubei |
206 |
206 |
0 |
157 |
33 |
124 |
558 |
188 |
Hunan |
174 |
174 |
0 |
91 |
9 |
83 |
462 |
96 |
Jiangxi |
152 |
152 |
0 |
97 |
27 |
70 |
423 |
109 |
Anhui |
225 |
225 |
0 |
233 |
11 |
222 |
679 |
280 |
Fujian |
321 |
32 |
289 |
91 |
18 |
73 |
957 |
102 |
Jiangsu |
441 |
177 |
264 |
302 |
5 |
297 |
1200 |
372 |
Shanghai |
55 |
10 |
45 |
38 |
0 |
37 |
150 |
51 |
Zhejiang |
429 |
50 |
379 |
112 |
4 |
108 |
1163 |
121 |
National |
10948 |
8694 |
2254 |
45604 |
41878 |
3726 |
29308 |
66529 |
2.2. Power System
The RMC model covers a full range of electricity generation, transmission, and storage in and between the 31 provinces’ power systems. It can run with an annual time resolution consistent with other modules and or be linked with a dedicated power system model CPOST with an hourly resolution (8760 hours for a modeled year) to capture more detailed characteristics in the power system. The spatial resolution and technologies in the power system are consistent between RMC and CPOST. Description of the CPOST model is available from its documentation (Renmin University of China, 2025).
2.2.1. Generation technologies
The power system encompasses a variety of power generation technologies, including fossil fuel-based generation, nuclear, and renewable energy like hydro, wind, solar, and biomass power generation, along with energy storage and transmission infrastructures.
In coal-fired power generation, there are advanced technologies such as large ultra-supercritical and supercritical units, as well as relatively low efficient subcritical technologies. Gas-fired power generation includes large combined cycle gas turbine (CCGT) units and conventional open-cycle gas turbine (OCGT). The system has also taken into account the integration of carbon capture and storage (CCS) technology within power generation units. The following shows the list of generation technologies, including both fossil and renewables in the model.
Coal w/o CCS: ultra-supercritical units (USC), supercritical units (SC), and subcritical units (Sub-C);
Coal w/ CCS: ultra-supercritical units with CCS, supercritical units with CCS;
Gas w/o CCS: combined cycle gas turbine (CCGT) and open cycle gas turbine (OCGT);
Gas w/ CCS: CCGT with CCS and OCGT with CCS;
Biomass w/ CCS;
Biomass w/o CCS;
Solar: centralized/distributed photovoltaic (PV) power station and solar thermal power plant (concentrated solar power, CSP);
Wind: onshore/offshore wind;
Nuclear.
Note that CCS is treated as an ‘add-on’ technology to the parent technology, e.g., coal-fired ultra-supercritical units or biomass power plants. More details on how CCS is modeled can be found in the MESSAGEix document.
2.2.2. Capital costs
Table 2-4 shows the cost trajectory of power generation technologies in a baseline scenario with references to several studies (McElroy et al., 2009; Lu et al., 2021; IEA, 2022, 2023b, 2023a, 2024; National Bureau of Statistics of China, 2022, 2023, 2024; Wang et al., 2022; China Meteorological Administration, 2023; Ember, 2023; CEIC, 2024; Dianchacha, 2024; EMBER, 2024). The model allows for adjustments to the cost of each specific generation technology in different scenario designs.
Technology |
2025 |
2030 |
2035 |
2040 |
2045 |
2050 |
2055 |
2060 |
|---|---|---|---|---|---|---|---|---|
Coal w/o CCS |
631 |
606 |
583 |
563 |
546 |
533 |
523 |
514 |
Coal w/ CCS |
1015 |
932 |
860 |
798 |
753 |
719 |
695 |
668 |
Gas w/o CCS |
325 |
315 |
306 |
298 |
291 |
286 |
282 |
278 |
Gas w/ CCS |
678 |
617 |
564 |
519 |
487 |
463 |
446 |
427 |
Hydro |
2168 |
2059 |
1966 |
1873 |
1873 |
1873 |
1873 |
1873 |
Nuclear |
2311 |
2242 |
2173 |
2103 |
2034 |
1965 |
1910 |
1865 |
Solar PV (distributed) |
393 |
336 |
279 |
256 |
235 |
216 |
201 |
189 |
Solar PV (central) |
493 |
394 |
296 |
272 |
251 |
232 |
217 |
205 |
Solar PV (thermal) |
2329 |
1491 |
1400 |
1309 |
1227 |
1154 |
1095 |
1048 |
Onshore wind |
600 |
521 |
489 |
457 |
428 |
402 |
378 |
360 |
Offshore wind |
1383 |
1047 |
808 |
778 |
750 |
726 |
706 |
690 |
Biomass w/o CCS |
1290 |
1231 |
1191 |
1150 |
1113 |
1080 |
1053 |
1032 |
Biomass w/ CCS |
2321 |
2108 |
1936 |
1784 |
1668 |
1580 |
1515 |
1445 |
Battery storage |
824 |
798 |
773 |
764 |
757 |
750 |
744 |
740 |
Pumped-hydro storage |
1237 |
1090 |
1002 |
949 |
917 |
898 |
889 |
884 |
UHV transmission |
329 |
325 |
315 |
306 |
299 |
296 |
295 |
295 |
2.3. Other energy conversion
Similar to the power system, several district heating technologies based on fossil and renewable energy sources are considered in the RMC model. These heating plants feed heat into the district heating system that is then used in the end-use sectors.
Beyond electricity and centralized heat generation, there are three further subsectors of the conversion sector represented in the model, namely, liquid fuel production, gaseous fuel production, and hydrogen production.
In addition to oil refining, the main supply technology for liquid fuels currently, the model also encompasses a variety of alternative pathways for producing liquid fuels from diverse feedstocks, such as coal liquefaction, gas-to-liquids technologies, and biomass-to-liquids technologies, with and without the integration of CCS. Gaseous fuel production technologies cover biomass gasification and coal gasification. Hydrogen production includes gasification processes for coal and biomass, steam methane reforming from natural gas, and water electrolysis.
2.4. Technological advancement
In the RMC model, technological advancements are considered as exogenous factors and vary across scenarios. However, related studies have been conducted to incorporate the endogenous aspects of technological change through learning curves within energy-engineering models, as well as to examine how technology costs are influenced by market structures.
Cost and performance parameters, such as conversion efficiencies and emission factors, are typically sourced from the extant engineering studies. At the same time, alternative projections for costs and performance are formulated to account for a broad spectrum of uncertainties that significantly impact the model results for the future.
2.5. Energy demand
Energy service demands from end-use sectors such as industry, transportation, and residential/commercial are calculated with socio-economic development projections and exogenous to RMC. These demands are generated through the utilization of a scenario generator implemented in Python. The scenario generator correlates historical GDP per capita to final energy demands at the regional level. It extrapolates the sectoral energy service demands into the future, by leveraging projections of GDP and population growth. The scenario generator runs regressions on the historical datasets to establish the relationship for each of the 31 RMC regions between the independent variable (GDP per capita) and factors such as total final energy intensity, shares of final energy among several energy end-use sectors, and shares of electricity use between the industrial and residential/commercial sectors. With the input parameters, both the final energy intensity and the sectoral distribution can be projected.
Sector-specific models are under development and expected to link with the main RMC model in different ways.